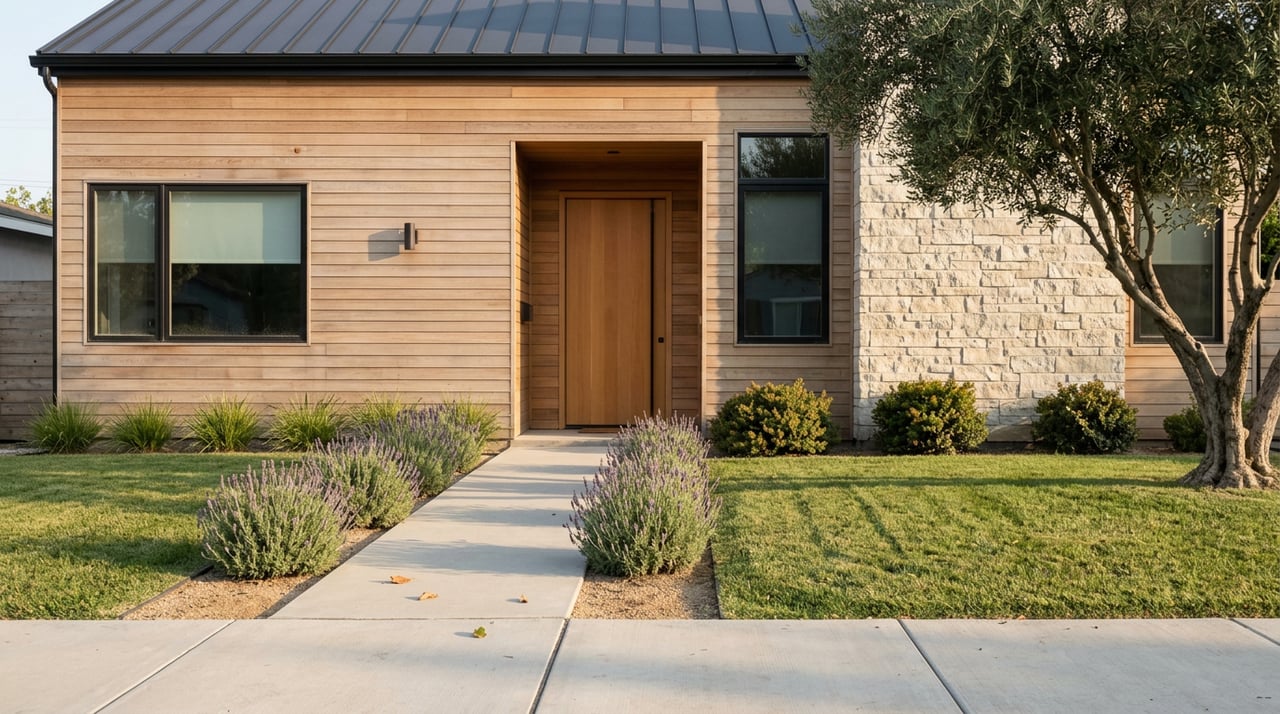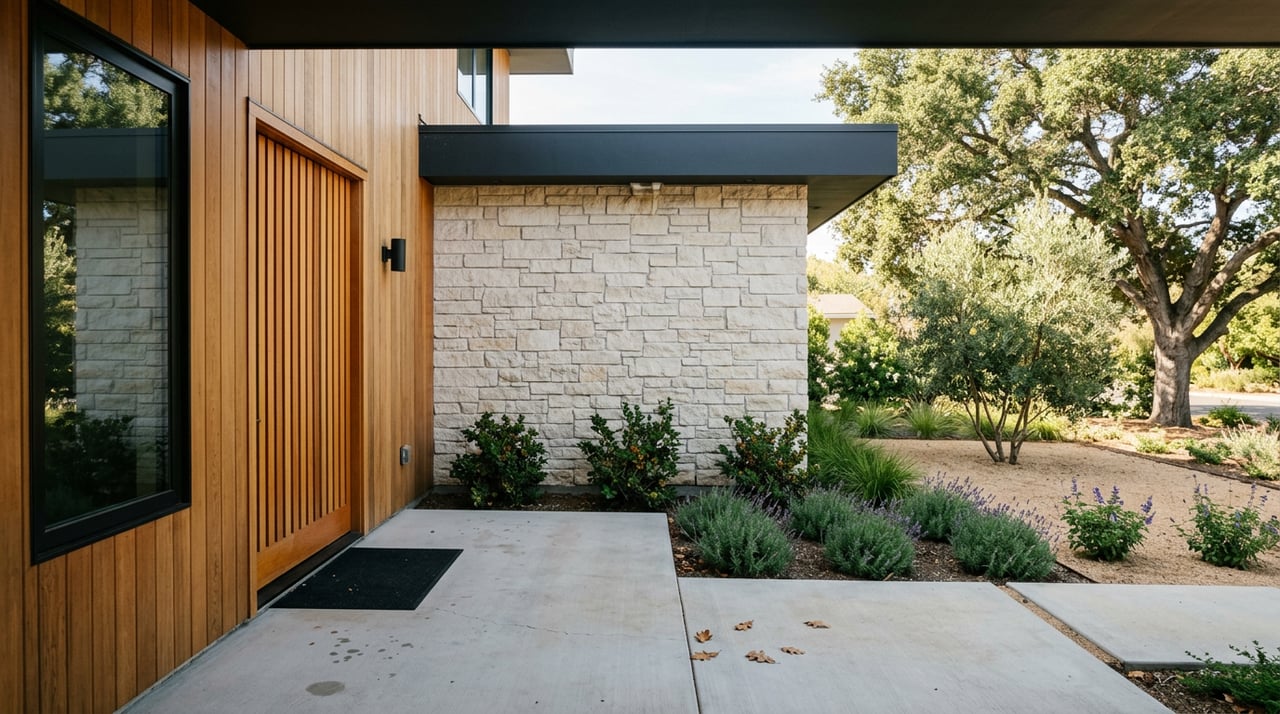
Every buyer comparing these two Fremont neighborhoods starts in the same place. They open a portal, see Mission San Jose homes trading around $2.3M and Warm Springs closer to $1.9M, and assume the $400K to $650K gap is the school premium showing itself. That reading is half right. It misses the two facts that actually decide whether a buyer is overpaying, and it misreads which of the two markets is running hotter this spring.
The sticker price gap is real. The story it tells is not the one most buyers walk in with.
The two facts that undo the sticker-price story
Start with pace. In February 2026, Warm Springs was selling at roughly 104.7% of list price in about 7 days on market, while Mission San Jose was closer to 103.1% of list in 9 days, per RPR data pulled from MLS Listings. Mission San Jose is more expensive. Warm Springs is more competitive.
Then look at the citywide backdrop. Redfin put Fremont's median at $1.6M with a 14 day median time on market over the three months ending May 2026. The Bay East Association of REALTORS clocked detached single-family homes selling at 106% of list with about 1.7 months of supply in February. Zillow's ZHVI showed the city average at $1.52M as of the May 31, 2026 update, down 4.1% year-over-year. Different methodologies produce different midpoints, but every source points to the same underlying condition: constrained supply and disciplined buyers who are still willing to pay over ask for the right property.
| Metric (early 2026) | Mission San Jose | Warm Springs |
|---|---|---|
| Median sold price | ~$2.29M (RPR, Feb) | ~$1.64M–$1.9M (RPR / Redfin, Feb) |
| Sale-to-list ratio | ~103.1% | ~104.7% |
| Median days on market | ~7–9 | ~7 |
| Housing stock | Older ranch, established | 1990s–2010s, newer builds and townhomes |
| BART access | ~12–15 min drive to Warm Springs station | Walk or 5–10 min to Warm Springs station |
Both are seller markets. Warm Springs is the tighter of the two right now, and it has appreciated more in percentage terms since the BART extension opened in March 2017.
What the Mission San Jose premium actually buys
The premium is not a market temperature. It is a hedge on school-district certainty.
Mission San Jose High, Hopkins Junior High, and Mission San Jose Elementary form one of the highest-rated K–12 clusters in California, and the buyer pool for that cluster is deep, dual-income, and largely indifferent to interest rate movements. That is why the neighborhood holds value in cooling markets. What the premium does not buy is speed. In this cycle, homes near the Warm Springs BART station are moving faster than homes zoned for MSJ.
Buyers frequently miss the boundary detail. A 94539 ZIP code does not guarantee an MSJ school assignment. Portions of 94539 fall inside the Irvington Attendance Area, which feeds Horner Middle and Irvington High, not Hopkins and MSJ High. Verifying the exact assignment through the Fremont Unified School District locator before writing an offer is not optional at this price point. It is the single largest variable that changes a home's resale ceiling.
A useful sanity check for FUSD buyers: Warm Springs is served by the only split-grade elementary setup in the district. James Leitch handles TK through Grade 2, Warm Springs Elementary handles Grades 3 through 5, and Fred E. Weibel Elementary runs a full K through 5 program serving the Weibel area. Any listing that describes itself as "MSJ-adjacent" is worth checking against the FUSD map before the offer, not after.
The Mello-Roos wedge that only shows up in escrow
Median price is a headline. Effective monthly carrying cost is what the family actually writes checks for, and this is where Warm Springs and Mission San Jose diverge in a way the portals do not surface.
California's base property tax rate is 1% of assessed value under Proposition 13, plus local levies that typically bring the effective rate to roughly 1.1% to 1.25% in most of Fremont. Homes.com reports Fremont's effective rate at about 0.76% based on paid taxes, slightly above San Jose's 0.71%. Both are useful floors.
The wedge is the Community Facilities District assessment layer. In newer Warm Springs developments, Mello-Roos and CFD charges can add roughly $200 to $600 or more per month to the effective tax burden. On a $1.9M Warm Springs purchase, an extra $500 per month is $6,000 a year of after-tax cash, or the equivalent of about $110,000 of additional mortgage principal at current rates. That is enough to close a meaningful portion of the raw price gap between a newer Warm Springs home and an older MSJ home before the buyer signs a single contingency.
Before you commit to a Warm Springs offer, request:
- The Natural Hazard Disclosure report and the full property tax history for the parcel, not just the current year.
- A written statement of any active Mello-Roos or CFD assessment, its annual escalator, and its expiration date.
- The HOA reserve study and current operating budget if the property is a townhome or condo, since underfunded reserves in newer TOD-adjacent buildings translate to special assessment risk.
- Confirmation of the FUSD attendance area assignment for the exact address, in writing.
None of these are unusual asks. All of them shift the negotiation.
Why Warm Springs is trading hotter, not cheaper
The Warm Springs pace is not a discount phenomenon. It is a demand phenomenon that the market is still catching up to.
The Warm Springs/South Fremont BART station sits at the heart of Fremont's 850 acre Innovation District, and the employment mix around it has thickened considerably. Tesla's factory is a 5.3 million square foot operation with an approved master plan to expand by another 4.6 million square feet, per the City of Fremont's economic development office. The surrounding district houses Zoox, Seagate, Western Digital, ThermoFisher Scientific, Lam Research, and FM Industries, along with the Lennar transit-oriented development lots that will add roughly 966 residential units and ground-floor retail across three five-story buildings adjacent to the station.
For a household with one BART commuter to San Francisco or Oakland and one Peninsula commuter using the Dumbarton Bridge, Warm Springs is functionally closer to both jobs than Mission San Jose. That is a real quality-of-life gap, and it explains why homes in the neighborhood have compressed their days-on-market number even while nominal prices sit below MSJ.
Mission San Jose still has the deeper resale pool and the stronger absolute-dollar appreciation history. Warm Springs has the near-term momentum and the newer housing stock. The two markets are not really competitors. They serve different optimizers.
Choosing based on friction, not median
A buyer who is optimizing for school-cluster certainty and is willing to accept an older ranch home on a larger lot is buying Mission San Jose. That buyer should plan on a fully underwritten pre-approval, not a basic pre-qualification letter, and should expect to compete against nine or ten offers on well-prepared listings. The friction here is offer strategy and contingency structure, not carrying cost.
A buyer who is optimizing for commute, newer construction, and BART walkability is buying Warm Springs. That buyer needs to model Mello-Roos, verify the school attendance area, and read the HOA reserve study line by line if the property is anything other than a detached single-family home. The friction here is total monthly cost and disclosure discipline, not offer count.
The median price gap between the two neighborhoods is the answer to a question most buyers are not actually asking. The right question is which set of friction points the household is best equipped to manage.
Frequently asked questions
Is the price gap between Mission San Jose and Warm Springs going to close? The percentage gap has narrowed since the BART extension opened in March 2017, driven by Innovation District employment growth. Absolute-dollar appreciation still favors Mission San Jose because of the larger price base and the school-cluster demand floor. Both trends can coexist.
Does a 94539 ZIP code guarantee MSJ schools? No. Some 94539 streets fall within the Irvington Attendance Area and feed Horner Middle and Irvington High. Verify the specific address using the FUSD school locator before writing an offer.
How large is the Mello-Roos exposure in Warm Springs? In newer developments, expect roughly $200 to $600 or more per month in CFD charges on top of the base property tax rate. Confirm the exact figure, the escalator, and the expiration date for the specific parcel during disclosure review.
Which neighborhood is a stronger long-term hold? Both have delivered appreciation through multiple cycles. Mission San Jose has the deeper resale pool and stronger absolute-dollar history. Warm Springs has the newer stock, transit access, and stronger recent percentage appreciation. The right answer depends on holding period and household priorities, not on which neighborhood has the higher median.
Deciding between Mission San Jose and Warm Springs is a modeling exercise as much as a preference call, and the numbers that matter most are the ones the portals do not display. For a written cost-and-strategy comparison built around your household's specific commute, school, and holding-period assumptions, Rajiv Kohli offers a private consultation and a free, address-level home valuation. Schedule the conversation before you tour, not after.