SANTA CLARA COUNTY REAL ESTATE MARKET UPDATE - JANUARY 2025-NOVEMBER 2025
This chart shows number of homes for sale, sold, in-contract and new listings each month.

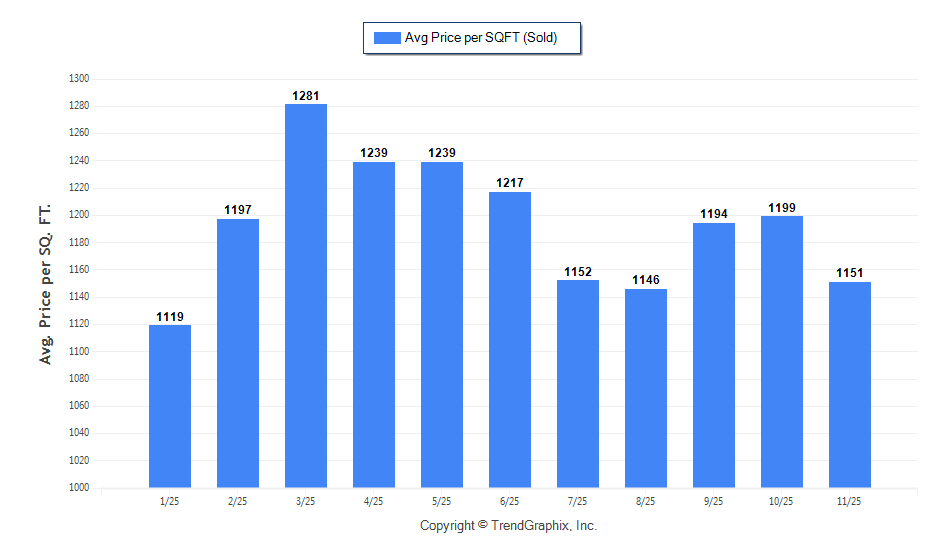
The graph shows Price Per SQFT of Single Family Homes in Santa Clara County in 2025. March 2025 was the best time for sellers as they were able to get the highest possible price.

The graph below shows months of inventory in 2025 each month. In November, inventory dropped to 1 month making it still a fairly strong seller's market. Homes that show well, marketed well and are priced well are still selling fast.

No surprise here as we saw higher buyer demand in Feb and March. Sale to list price ratio was 108 for March with only 15 days to get the home in-contract once Listed.

December is behaving like as December always does. We have very motivated buyers looking to get an offer on the table. So if you know someone looking to buy a home in the bay area, have them reach out to me and I can bring them list of homes that have taken $200K+ in price drop. We have over 1350 homes for sale in Santa Clara County in December.